Run sensitivity analysis on Well Length using a Horizontal dP friction IPR model
Load the OpenServer package
library(rOpenserver)
Enter the well lengths for iteration
text_well_length <- "
well_length
500
1000
1500
2000
2500
3000
3500
4000
4500
5000
5500
6000
6500
7000
7500
8000
8500
"

df_wl <- read.table(text = text_well_length, header = TRUE)
df_wl$liquid_rate <- 0
df_wl
#>    well_length liquid_rate
#> 1          500           0
#> 2         1000           0
#> 3         1500           0
#> 4         2000           0
#> 5         2500           0
#> 6         3000           0
#> 7         3500           0
#> 8         4000           0
#> 9         4500           0
#> 10        5000           0
#> 11        5500           0
#> 12        6000           0
#> 13        6500           0
#> 14        7000           0
#> 15        7500           0
#> 16        8000           0
#> 17        8500           0
The table above is equivalent to this sequence:
well_length <- 1000
seq(well_length-well_length*50/100, by = well_length*50/100, length.out = 17)
#>  [1]  500 1000 1500 2000 2500 3000 3500 4000 4500 5000 5500 6000 6500 7000 7500
#> [16] 8000 8500
Function to get the model filename
This function will go grab the horizontal well model for analysis.
get_prosper_model <- function(model) {
    # get the well model
    models_dir <- system.file("models", package = "rOpenserver")
    model_file <- file.path(models_dir, model)
    if (!file.exists(model_file)) stop("Model not found ...") else
        return(model_file)

}

get_prosper_model(model = "HORWELLDP.OUT")
#> [1] "C:/Users/ipm/AppData/Local/Temp/RtmpwBxUCZ/temp_libpath1b2cc5956da/rOpenserver/models/HORWELLDP.OUT"
Start Prosper
# Initialize OpenServer
prosper_server <- .OpenServer$new()

# Start Prosper
cmd = "PROSPER.START"
prosper_server$DoCmd(cmd)
#> [1] 0
Iterate through well lengths
# iterate through all well length values of interest
i <-  1
for (wlen in df_wl[["well_length"]]) {
  prosper_server$DoSet("PROSPER.SIN.IPR.Single.WellLen", wlen)           # set well length
  prosper_server$DoSet("PROSPER.SIN.IPR.Single.HorizdP[0].ZONLEN", wlen) # set length in zone 1
  prosper_server$DoCmd("PROSPER.anl.SYS.CALC")    # do calculation
  df_wl[["liquid_rate"]][i] <-                       # store liquid rate result in dataframe
    as.double(prosper_server$DoGet("PROSPER.OUT.SYS.RESULTS[0][0][0].SOL.LIQRATE"))
  cat(wlen, df_wl[["liquid_rate"]][i], "\n")
  i <-  i + 1
}
#> 500 7376.862
#> 1000 8763.273
#> 1500 9422.393
#> 2000 9815.624
#> 2500 10077.37
#> 3000 10263.01
#> 3500 10400.36
#> 4000 10505.03
#> 4500 10585.19
#> 5000 10647.39
#> 5500 10696.97
#> 6000 10736.87
#> 6500 10768.8
#> 7000 10794.94
#> 7500 10813.41
#> 8000 10830.17
#> 8500 10843.63

df_wl
#>    well_length liquid_rate
#> 1          500    7376.862
#> 2         1000    8763.273
#> 3         1500    9422.393
#> 4         2000    9815.624
#> 5         2500   10077.367
#> 6         3000   10263.006
#> 7         3500   10400.360
#> 8         4000   10505.026
#> 9         4500   10585.193
#> 10        5000   10647.387
#> 11        5500   10696.969
#> 12        6000   10736.874
#> 13        6500   10768.802
#> 14        7000   10794.942
#> 15        7500   10813.414
#> 16        8000   10830.166
#> 17        8500   10843.626
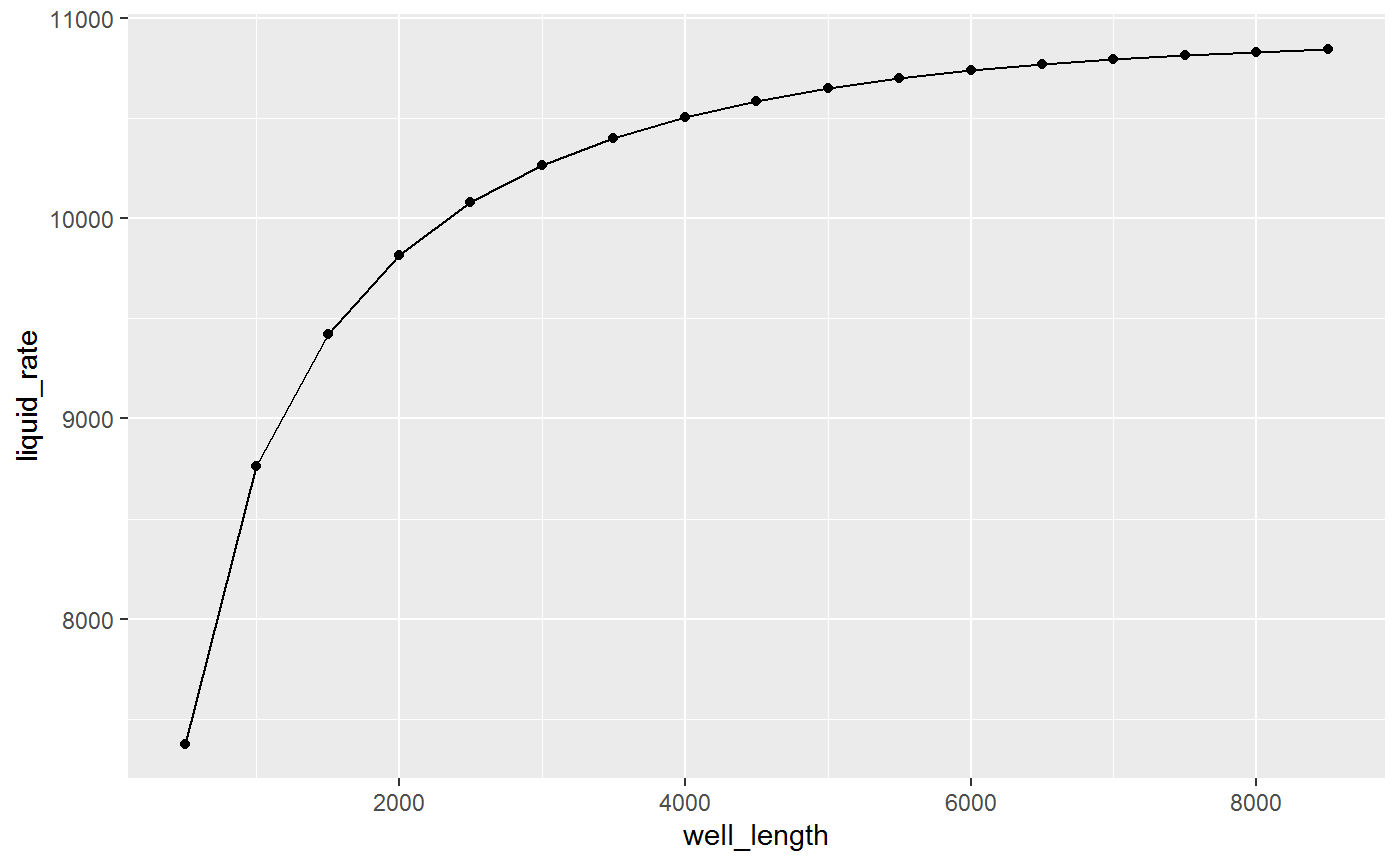
Plot the results
library(ggplot2)

ggplot(df_wl, aes(x = well_length, y = liquid_rate)) +
  geom_line() +
  geom_point()